Cluster Overview Page#
After a successful login, the Overview page displays and presents the basic cluster health and status in summary panels. You can return to the Overview page using Cluster > Overview in the left navigation panel or by clicking the logo in the header bar.
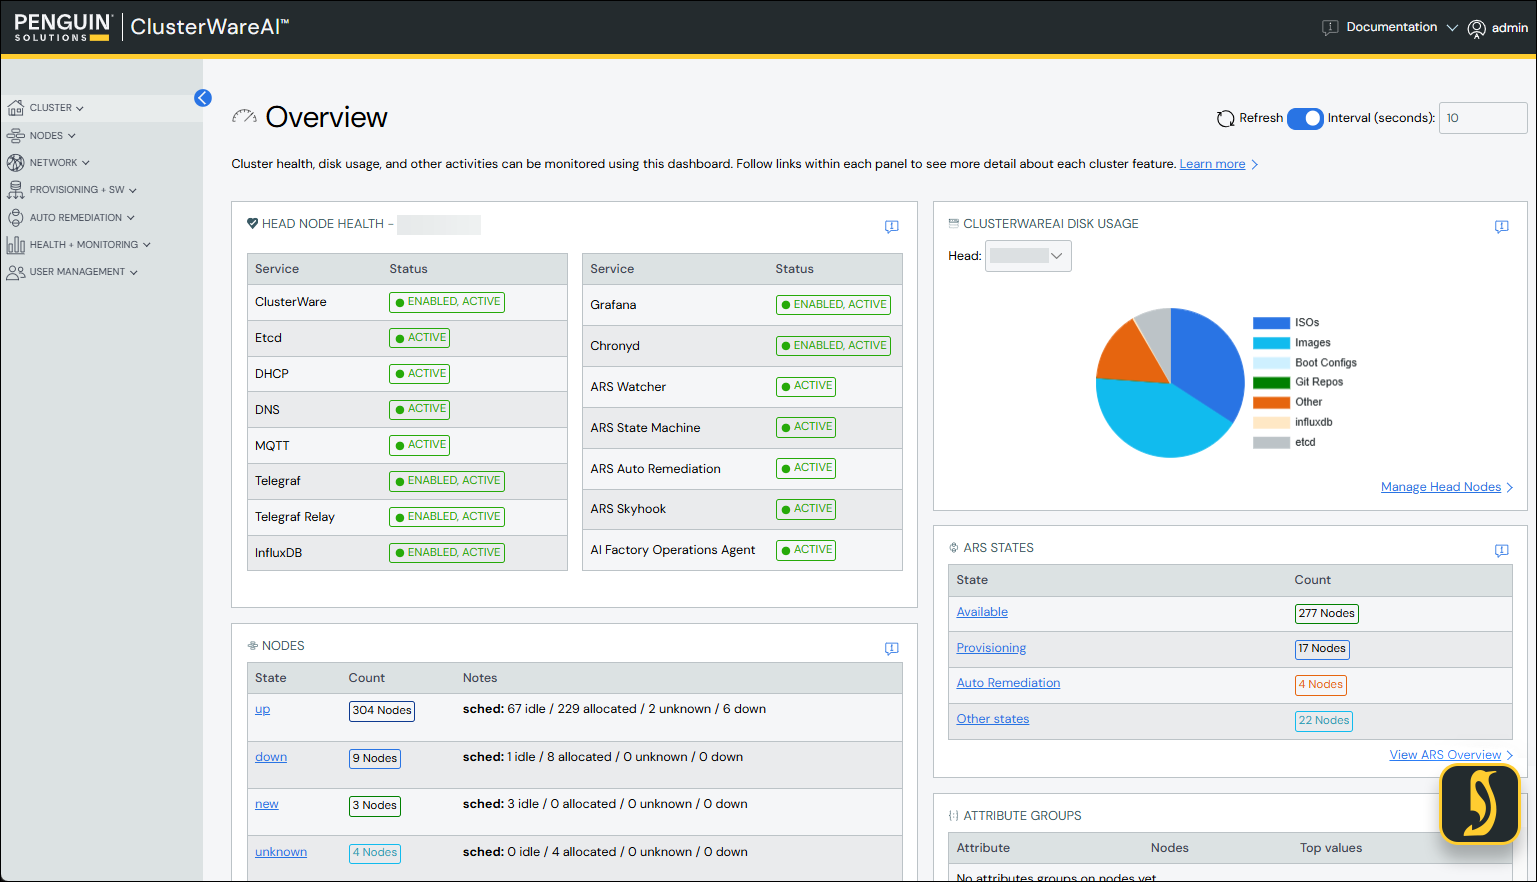
At the top of the Overview page is a link to the locally installed ClusterWareAI ™ HTML documentation. The upper right of each panel includes an "i" icon, which takes you to the relevant contextual documentation.
A link at the lower right of each panel (labeled Manage <panel-name>), or the panel title in the left sidebar takes you to that panel's detailed information.
The Refresh control is available on all pages and controls how often the GUI retrieves database contents. You can change the time interval or disable automatic updates altogether.
In a cluster with multiple head nodes, the ClusterWareAI Disk Usage panel has a drop-down list to select a specific head node.
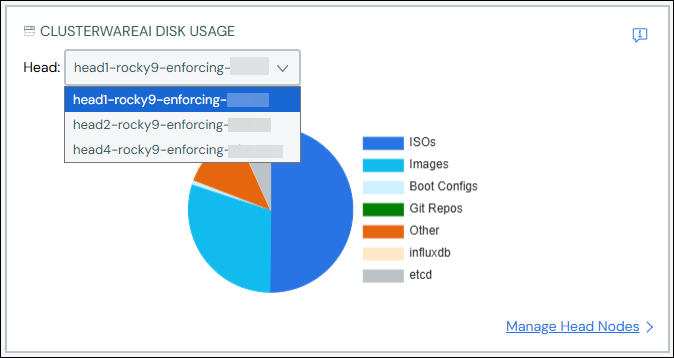
In example above, there are three head nodes. When you select a head node, the panel updates to display details for the selected head node's disk usage. Click the Manage Head Nodes link in the lower right to open the Head Nodes Page.
Other panels show status information about the cluster.
The Head Node Health panel shows details about each service on the current head node. Services that are down or activating are shown in red. The same service information is available if you run
cw-clusterctl heads ls -l.The ARS States panel gives an overview of the most populated ARS states by compute node count. A high number of compute nodes are in the Auto Remediation or Work Queue state could indicate a node health issue. Visit the ARS Overview Page linked from the panel to find any nodes that need human intervention.
The Nodes panel shows basic node status information for all compute nodes, such as how many nodes are currently up.
Other panels highlight other commonly referenced cluster primitives, including boot configurations and images.