ClusterWareAI Graphical User Interface#
The ClusterWareAI ™ graphical user interface (GUI) is available on all head nodes
using a browser to access http://<HEADNODE_IP>. The default authentication
is done through PAM, so cluster administrators can use their existing
credentials for the head node.
The ClusterWareAI GUI opens to an Overview page. Use the left navigation panel to access detailed pages for nodes, boot configurations, user management, and so on.
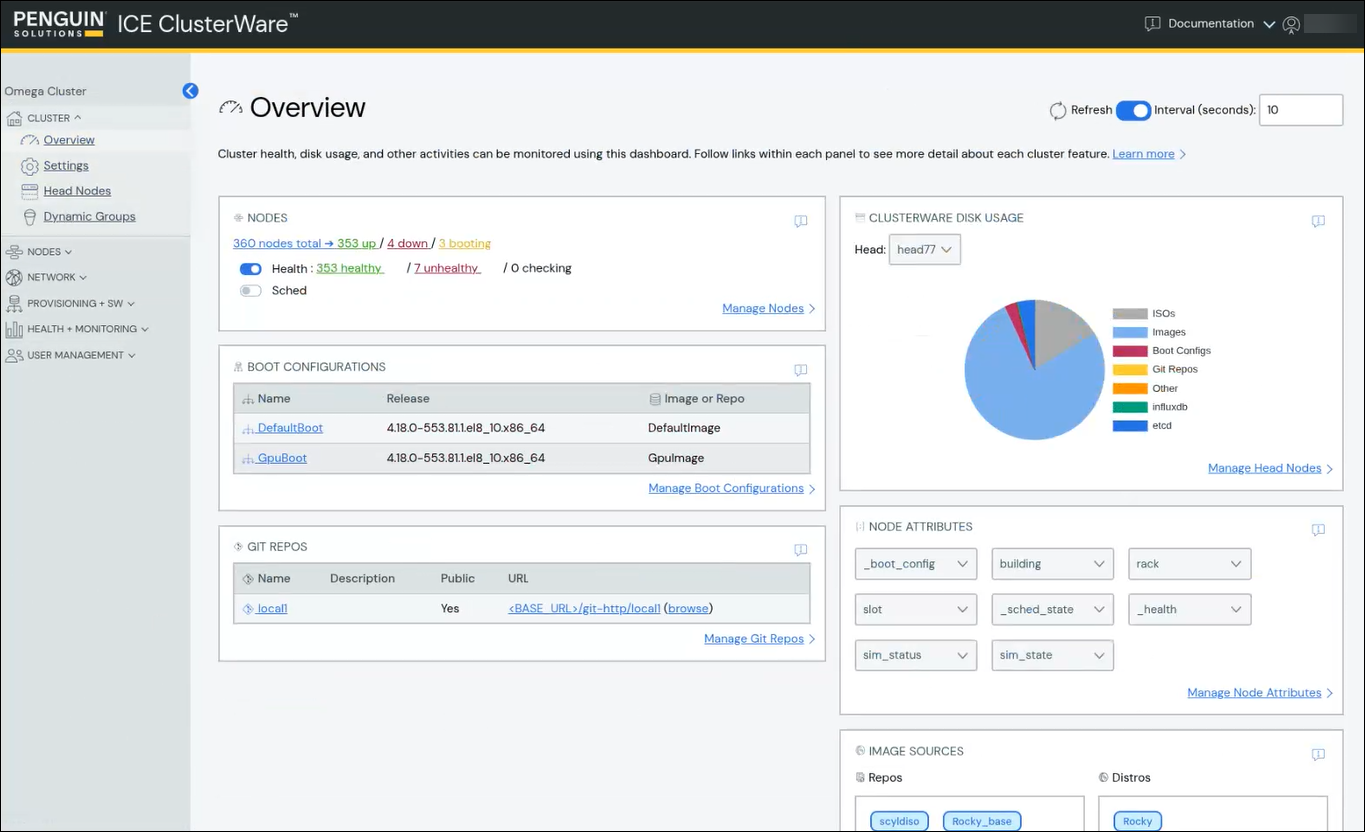
The following pages are available:
The Grafana Monitoring Dashboard (see Grafana Telemetry Dashboard) is also
available on all head nodes,
either by clicking on the Telemetry Dashboard link in the left navigation
pane or by accessing http://<HEADNODE_IP>/grafana.
The Grafana default credentials are the username "admin" and the
database.admin_pass from the base.ini:
sudo grep admin_pass /opt/scyld/clusterware/conf/base.ini
Administrators can change the password within the Grafana graphical interface.