Nodes Page#
To display the Nodes page, click Nodes > Compute Nodes in the left navigation panel or, from the Overview page, click the Manage Nodes link in the Nodes panel.
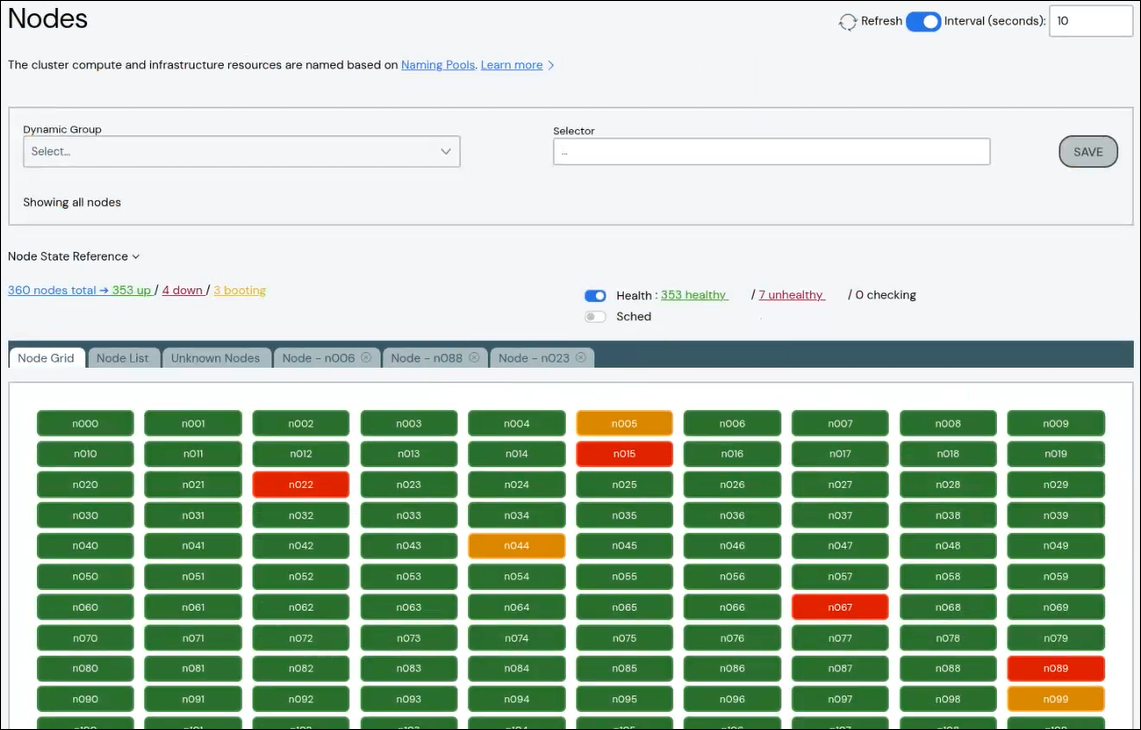
At the top of the Nodes page is a Node Filtering subpanel (see Node Filtering). Below that is a summary of the total node count, the counts of Up vs Down nodes, and the counts of healthy vs unhealthy nodes. These summary lines are clickable links that update the page to show just the nodes applicable to that summary link. For example, clicking "unhealthy" selects just the nodes currently reported as unhealthy. Clicking one of these links also updates the Selector field in the Node Filtering subpanel.
If you are using a job scheduler, such as Slurm, you can toggle the Sched switch to show scheduler status. For details on installing job schedulers, see Configure Job Schedulers. For details on configuring job schedulers to work with the ICE ClusterWare ™ platform, see Monitoring Scheduler Info.
Below the Node Filtering subpanel and summary links is the Node Grid/Node List subpanel showing each node in a potentially filtered display. Each node is color-coded to indicate status and health to quickly highlight any anomalies. Expand the Node State Reference panel to read about state and color mapping.
The Add New Node action is available at the bottom of the page. See Create Compute Node for details.
Node Filtering#
Node Filtering allows you to view, create, and manage subsets of compute nodes. Changing the filtering criteria updates the set of nodes displayed in the Node Grid or Node List.
A filter can be defined and saved as a Dynamic Group, which is dynamic in the sense that a specific filtering criteria may show different nodes when applied at different times. You can also create a dynamic group from the Dynamic Groups Page and it will be available to use as a filter on the Nodes page.
The following actions are available in the Node Filtering section:
Select a dynamic group - Selecting an existing dynamic group from the Dynamic Group menu updates the list of displayed nodes per the Selector field.
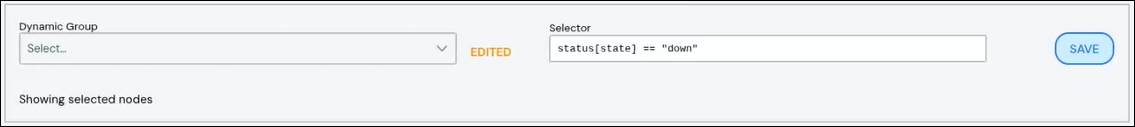
Enter a selector expression - Once a valid selector is entered into the Selector field, the list of displayed nodes updates. See Node Selectors for details.
You are given the option to save this selector expression as a dynamic group by clicking the Save button and entering a name and optional description. After creating the new dynamic group, it appears in the Dynamic Group menu and on the Dynamic Groups page.
Select Manage Dynamic Groups from the Dynamic Group menu - Opens the Dynamic Groups page.
Select Clear from the Dynamic Group menu - Resets node filtering.
Node Grid Display#
The Node Grid is a row/column grid display where each node is represented by a cell. Above the grid display is a panel containing node status summary information and display options. Each node/cell conveys data with its visual properties:
Label - This is the node name that appears on the cell. Long names are truncated. The full name is visible in the Node cell.
Node status - The background color of the cell indicates node status: green=UP, red=DOWN, orange=ALERT, gray=NEW.
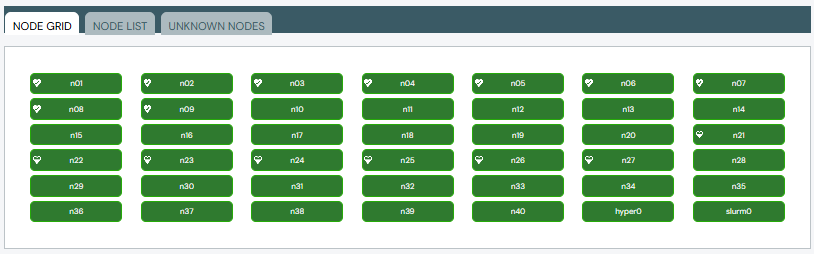
Scheduler status indicator - This indicator is present only if Slurm is configured. Possible values: UNKNOWN, READY/IDLE, BUSY, UNUSABLE/ERROR. If the indicator is ERROR, there may be an accompanying error message. This is displayed when hovering over the Scheduler Status Indicator.
You can interact with cells in multiple ways:
Hovering: Opens a pop-up containing additional identification and status information about the node.
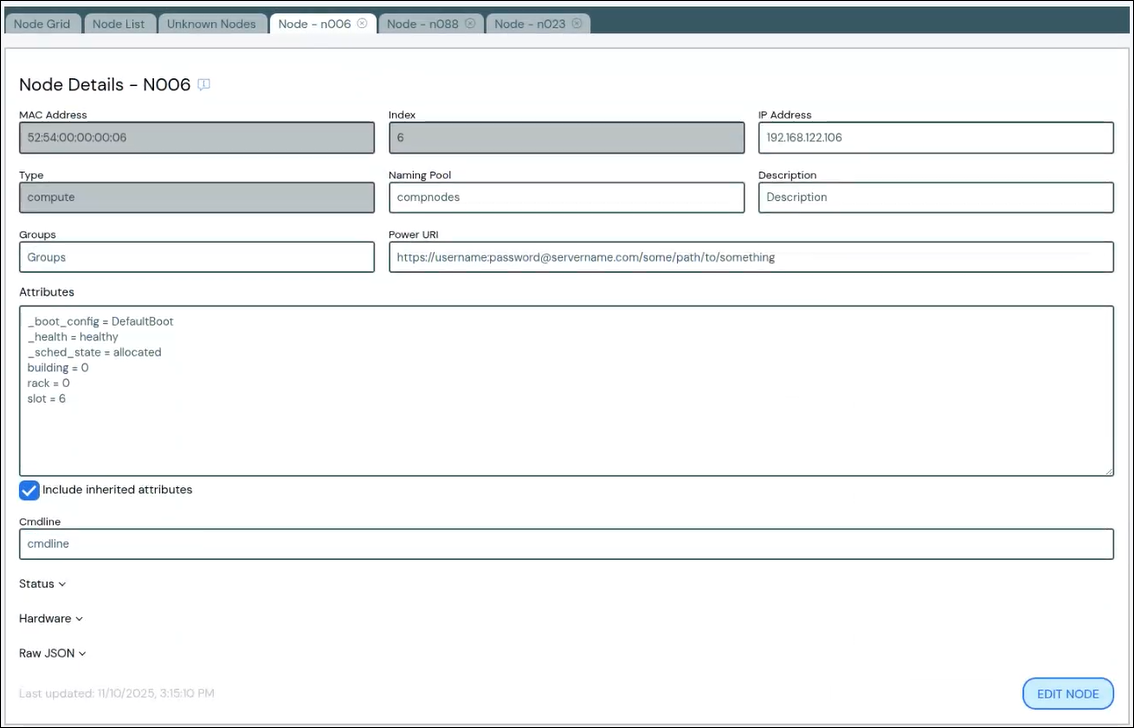
Dragging and Dropping Tab: Opens a tab containing node details and an option to edit the node. You can open node detail tabs for multiple nodes.
Clicking: Opens a tab containing node details and an option to edit the node.
Node List Display#
The Node List is a list of compute nodes in table format where each row is a single compute node. Like the Node Grid display, the Node List indicates node status using color-coding in the Status column. The list of nodes can be sorted by Name, Status, or Boot Configuration.
An Actions menu is
available above the table. Use the actions on one or more nodes by selecting the
checkbox for the node row(s) and picking an action from the menu. The action is
applied to all selected nodes. For example, you can power on all Down nodes.
Actions for individual nodes are available by clicking the More menu ![]() on the far right of the row.
on the far right of the row.
Tip
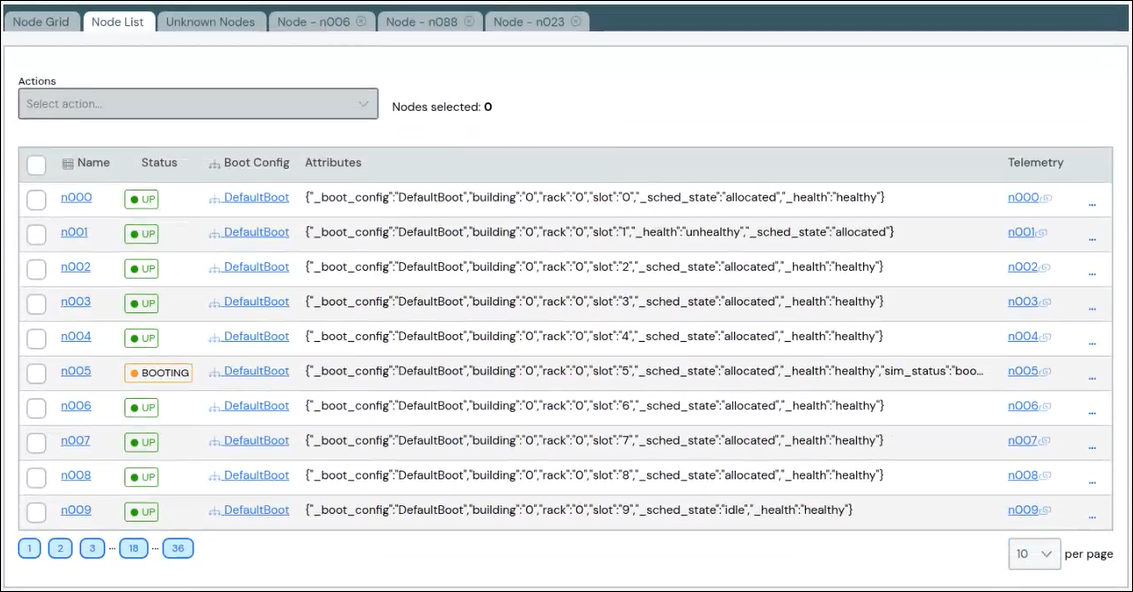
The Nodes selected indicator to the right of the Actions menu shows how many nodes are selected, which can be useful if the list of nodes spans multiple pages.
The example Node List display above shows an unfiltered list of nodes. You can adjust the number of nodes shown on each page using the drop-down at the lower right corner of the table. Switch between pages using the page number selectors at the lower left.
The example cluster has "unhealthy" nodes. Filter for those nodes by clicking the "unhealthy" link above the Node List table.
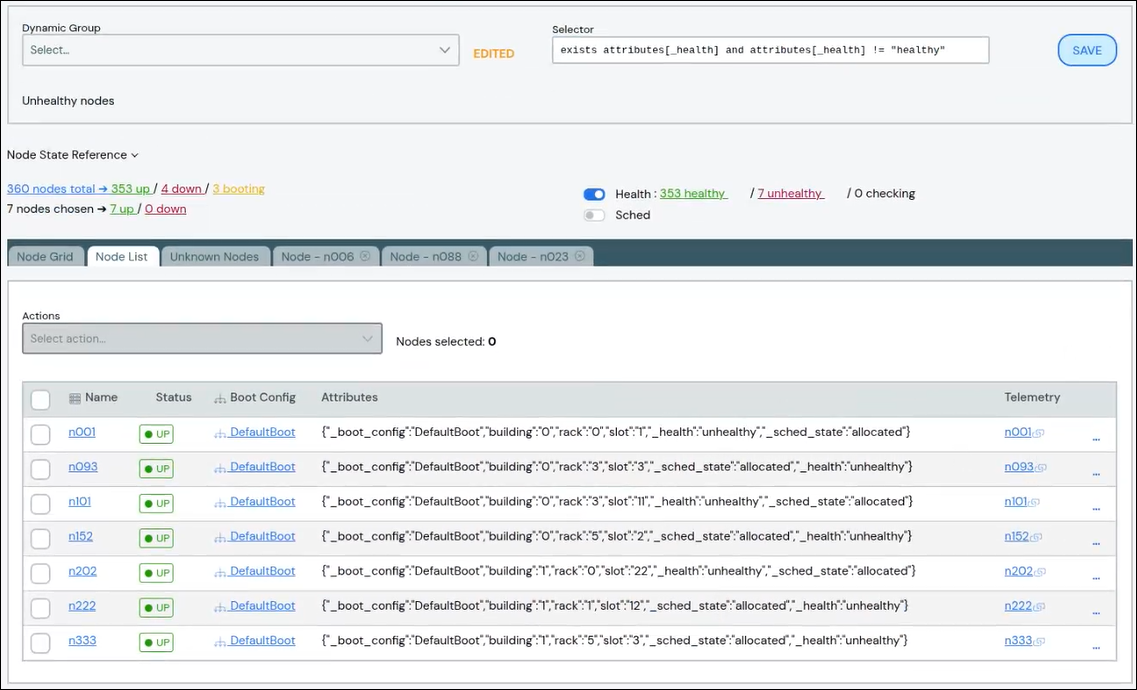
The node list updates to show only the unhealthy nodes and the Selector field is updated with the filter criteria.
Create Compute Node#
You can create a node using a form or by adding JSON.
To create a new node using a form:
Click the Add New Node button at the bottom of the page.
Add details about the node.
MAC Address: Required.
Index: Optional. Enter a number to control the node's index numbering. If unset, defaults to the next available index in the naming pool.
IP Address: Optional.
Naming Pool: Optional. Specify an existing naming pool. If unset, uses the default naming pool. See Node Names and Pools for details.
Description: Optional.
Groups: Optional. Specify an existing attribute group. All nodes are added to the DefaultAttribs attribute group. See Attribute Groups for details.
Power URI: Optional. Specify a power URI value. See Compute Node Power Control for details.
Attributes: Optional. Specify node-specific attributes in
name = valueformat. See Node Attributes for details.Cmdline: Optional. Specify a kernel command to use while the node is booting. If this value is set, it overrides the boot configuration.
Click Save. The new node appears in the list at the top of the page.
To create a node using JSON:
Click the Add New Node (JSON) button at the bottom of the page.
Enter node information:
Enter the node's MAC address in the text box. You can also create a node with multiple fields. For example:
{ "mac": "11:22:33:44:55:66", "attributes": { "_boot_config": "DefaultBoot" }}Add a JSON string to the text box. For example, the following string creates five compute nodes:
[ {"mac":"FF:11:22:33:44:55"}, {"mac":"11:22:33:a4:fe:66"},
{"mac":"22:33:44:55:66:77"}, {"mac":"00:99:88:77:66:55"},
{"mac":"ef:45:fd:43:23:54"} ]
Click Upload JSON to upload a JSON file.
Click Save. The new node appears in the list at the top of the table.
Edit Compute Node#
To edit a node from a node details tab:
Click the Edit Node Button.
Make updates to the node.
Click Save to save your changes.
To edit a node from the Node Grid or Node List display:
Click the node name to open the node details tab.
Click the Edit Node button.
Make updates to the node.
Click Save to save your changes.
Delete Compute Node#
You can only delete nodes from the Node List display.
To delete a node, click the More menu ![]() on the far right of the row and
select the Delete action.
on the far right of the row and
select the Delete action.
To delete one or more nodes, select the node(s) from the list, then select Delete from the Actions menu.
Additional Node Actions#
Additional actions are available from the Node List display. You can act on
a single node using the More menu ![]() on the far right of the row or you
can act on multiple nodes by selecting them from the list, then selecting an
action from the Actions menu.
on the far right of the row or you
can act on multiple nodes by selecting them from the list, then selecting an
action from the Actions menu.
The following actions are available:
Note
The Reboot and Reboot - kexec actions are ignored for nodes with _no_boot or _busy set to true. The Power on, Power off, and Cycle power actions are ignored for nodes with _no_boot set to true.
Execute: Enter a command in the Command section of the pop-up window and click Run to execute the command on the selected node(s). For example, you may want to execute a command that generates a list of the network controller model numbers installed on a set of nodes.
Commands executed on multiple nodes execute in parallel, which means their output may be interleaved or not in node index order. You can override this and print the output in node index order by selecting In order from the Output Format drop-down. See the cw-nodectl
execargument for more details.Reboot: Reboot the selected node(s). A soft reboot (SSH method) is attempted first. If the node does not reboot after 5 seconds (default), a hard power cycle (IPMI method) is attempted.
Reboot - kexec: Boot directly into a new kernel without a full reboot. See the cw-nodectl
reboot --kexecargument for more details.Shutdown: Shut down the selected node(s). A soft shut down (SSH method) is attempted first. If the node does not begin a shut down, a hard power off (IPMI method) is performed.
Power on: Power on the selected node(s). Uses
ipmitooland the node's power_uri field to control node power.Power off: Power off the selected node(s). Uses
ipmitooland the node's power_uri field to control node power.Cycle power: Power off and on the selected node(s). Uses
ipmitooland the node's power_uri field to control node power.Edit: See Edit Compute Node.
Open Telemetry or Open Node Monitoring: Opens the Grafana monitoring tool. See Grafana Login and Grafana Cluster Monitoring.
Join Group: Add the selected node(s) to an attribute group.
Leave Group: Remove the selected node(s) from an attribute group.
Delete: See Delete Compute Node.