Grafana Cluster Monitoring#
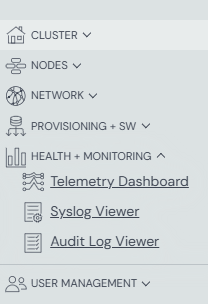
Access and log in to Grafana through the
Health + Monitoring links in the ICE ClusterWare ™ GUI
left navigation panel, directly using http://<HEADNODE_IP>/grafana, or for
a specific node from the node details within the ClusterWare GUI.
Note
The URL http://<HEADNODE_IP>/grafana may differ if the cluster
administrator has switched to HTTPS or otherwise modified the Apache
configuration.
Within Grafana, the ClusterWare - Cluster Monitoring dashboard displays a summary of current activity on the head node and all compute nodes and is shown upon intial login.
The following example shows the head node and first several nodes of a 49-node CPU-only cluster.
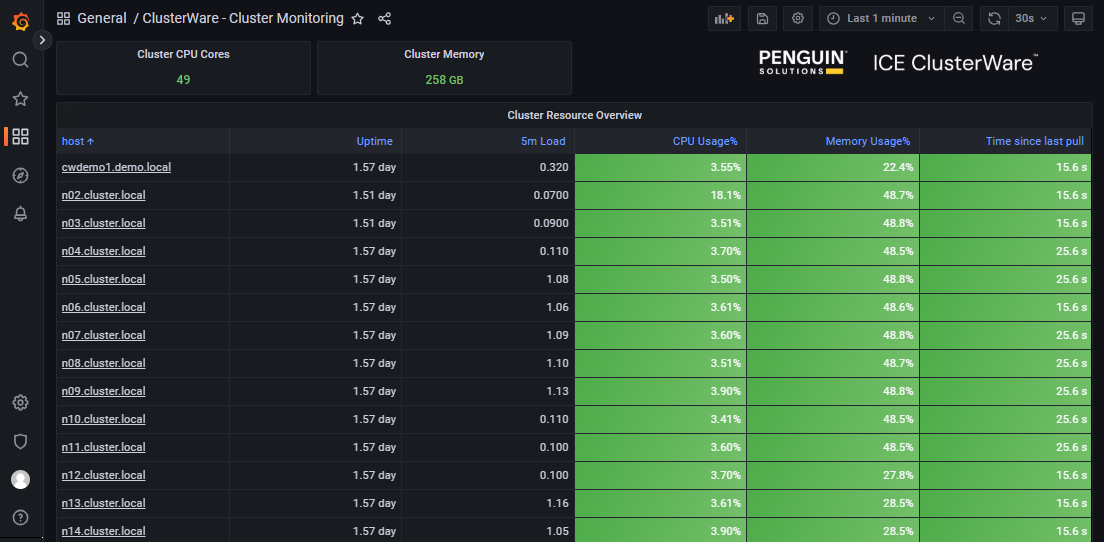
For clusters that include GPUs, the dashboard includes an additional column displaying GPU usage.
Grafana General Page#
Click General / ClusterWare - Cluster Monitoring at the top of the page to display a list of the available dashboards.
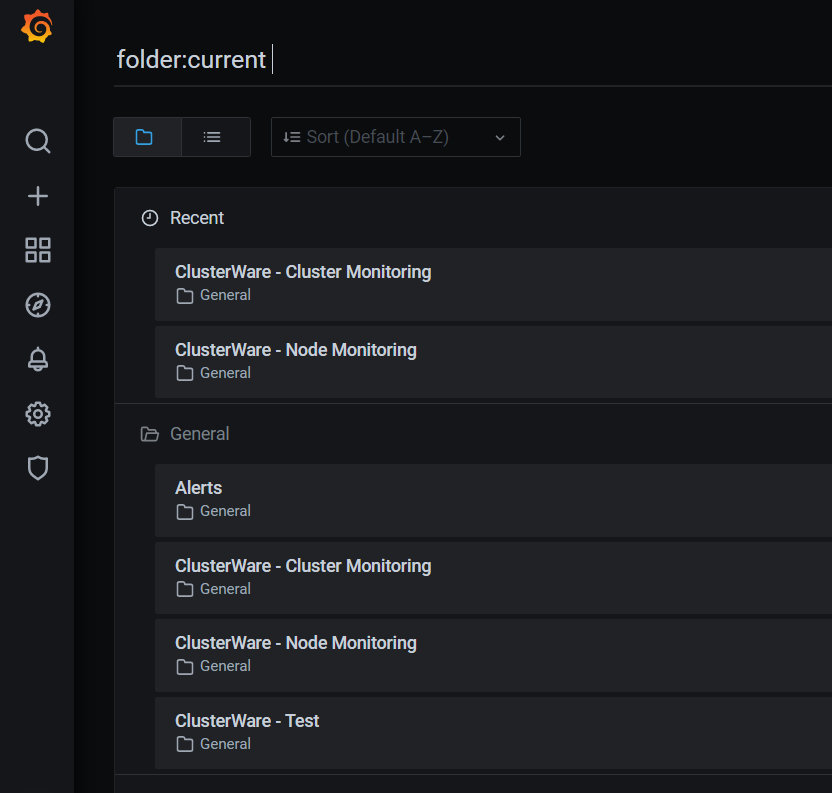
The menu lists the Recent dashboards as well as the full General list. The list of dashboards varies based on your cluster hardware. Click ClusterWare - Node Monitoring to display detailed state and activity data for individual nodes. If your cluster includes NVidia GPUs, click NVidia GPU Dashboard to display details about GPU temperature, power draw, CUDA version, clock speeds, and so on.
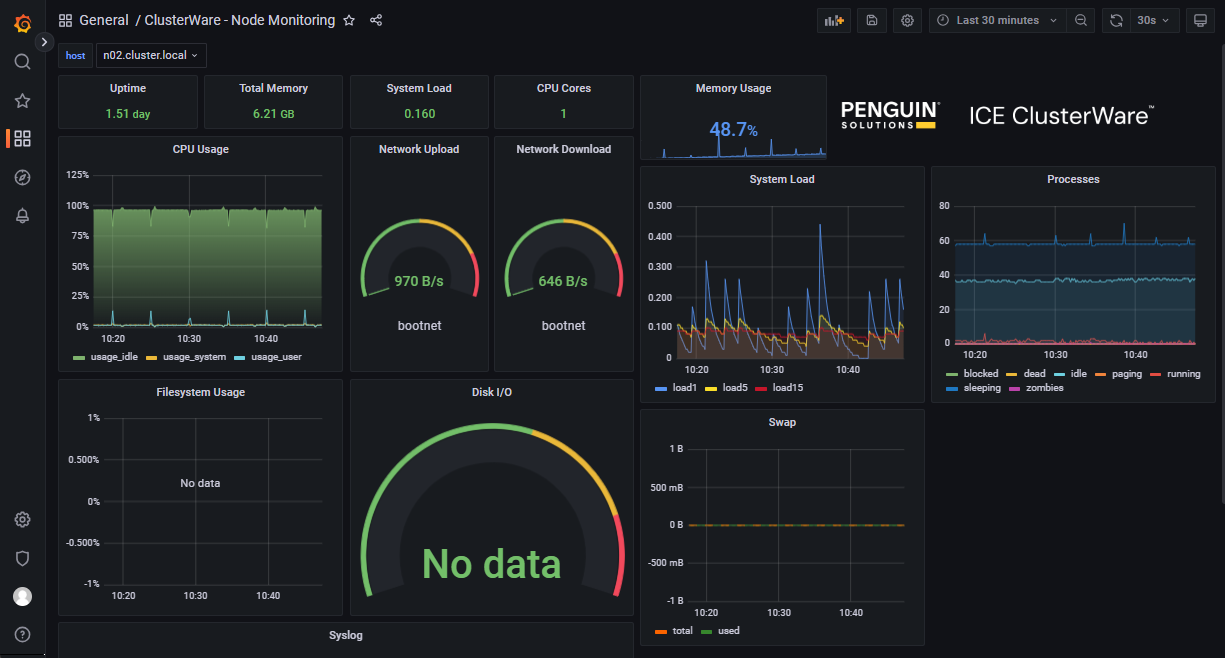
Grafana Node Monitoring#
The default Node Monitoring display shows details for individual nodes, beginning with the head node.
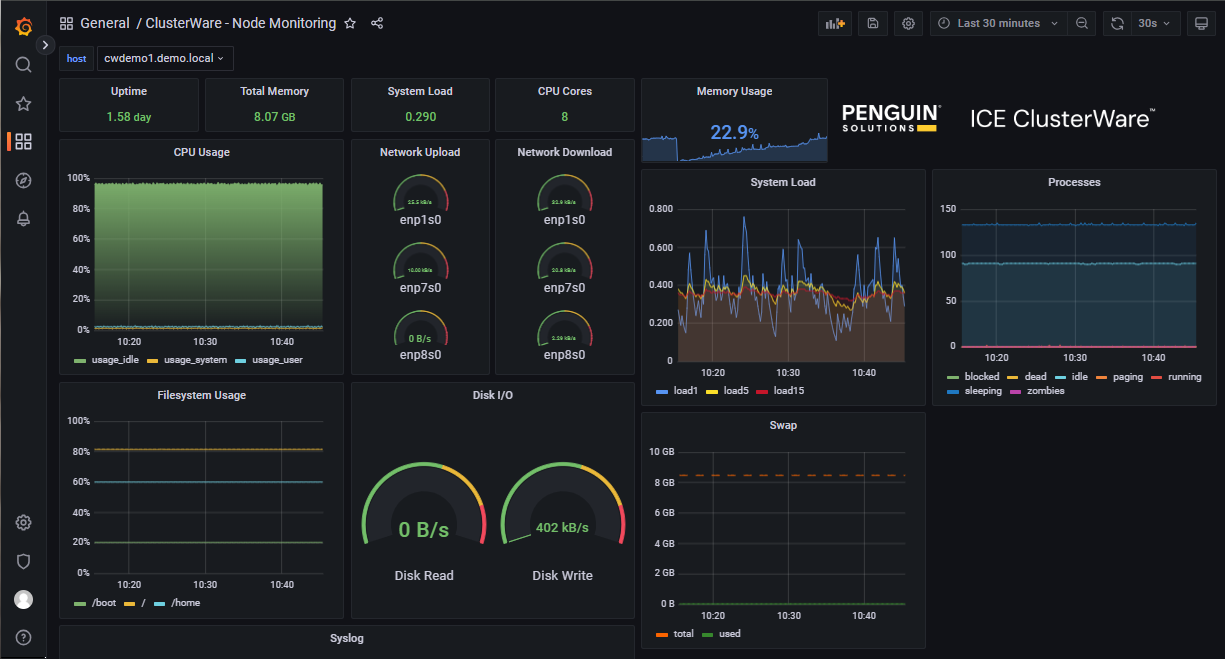
Click the drop-down list with the current node name at the top left of the dashboard to select a different node in the cluster.
For example, select "n02.cluster.local":
Grafana Syslog and Auditing Monitoring#
Grafana includes ClusterWare - Syslog Viewer and ClusterWare - Audit Log Viewer dashboards. You can access these dashboards from the list of dashboards within Grafana or from the Health + Monitoring section of the ClusterWare GUI left navigation panel.
By default, both dashboards show MQTT data from the head node(s). If you have configured auditing or syslog collection from compute nodes, that data is also available.
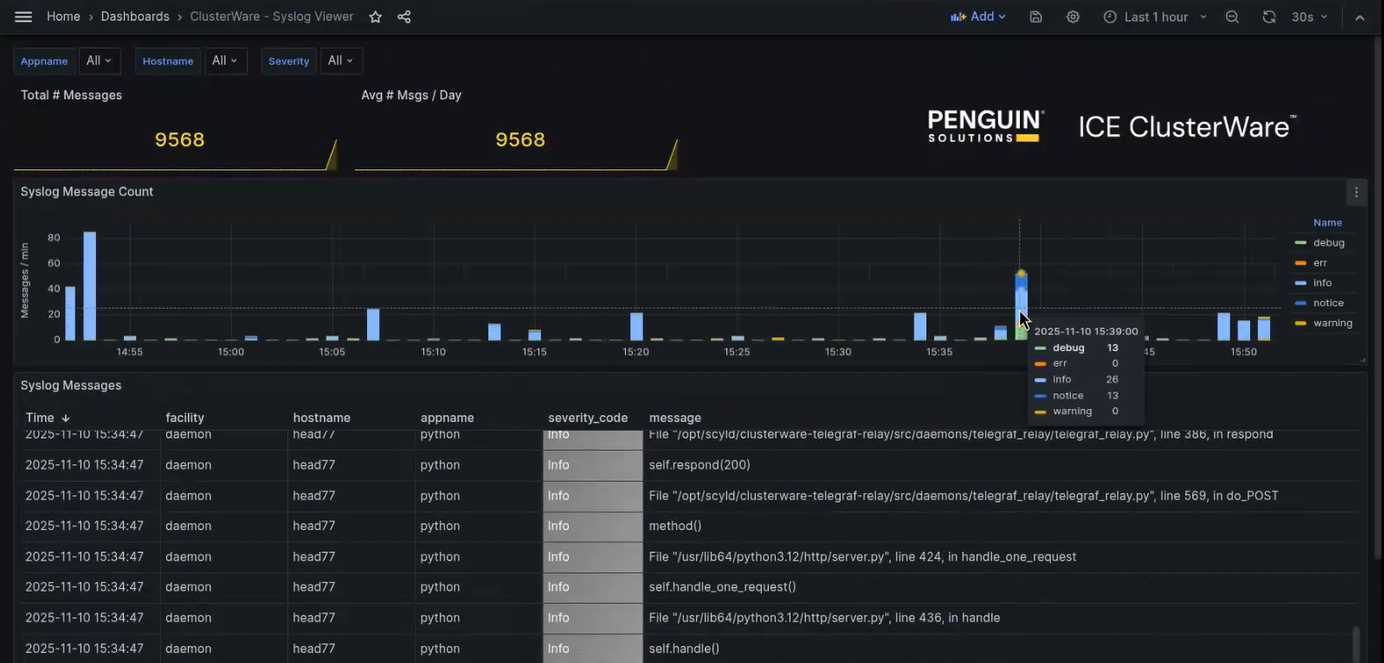
The ClusterWare - Syslog Viewer dashboard shows messages based on message type, such as error or warning. Spikes in messaging can indicate an issue that requires further investigation. Click a message type next to the graph to filter based on that message type. You can also use the drop-down lists at the top of the page to filter by node or the application that logged the message. See Log Files to review and adjust logging levels.
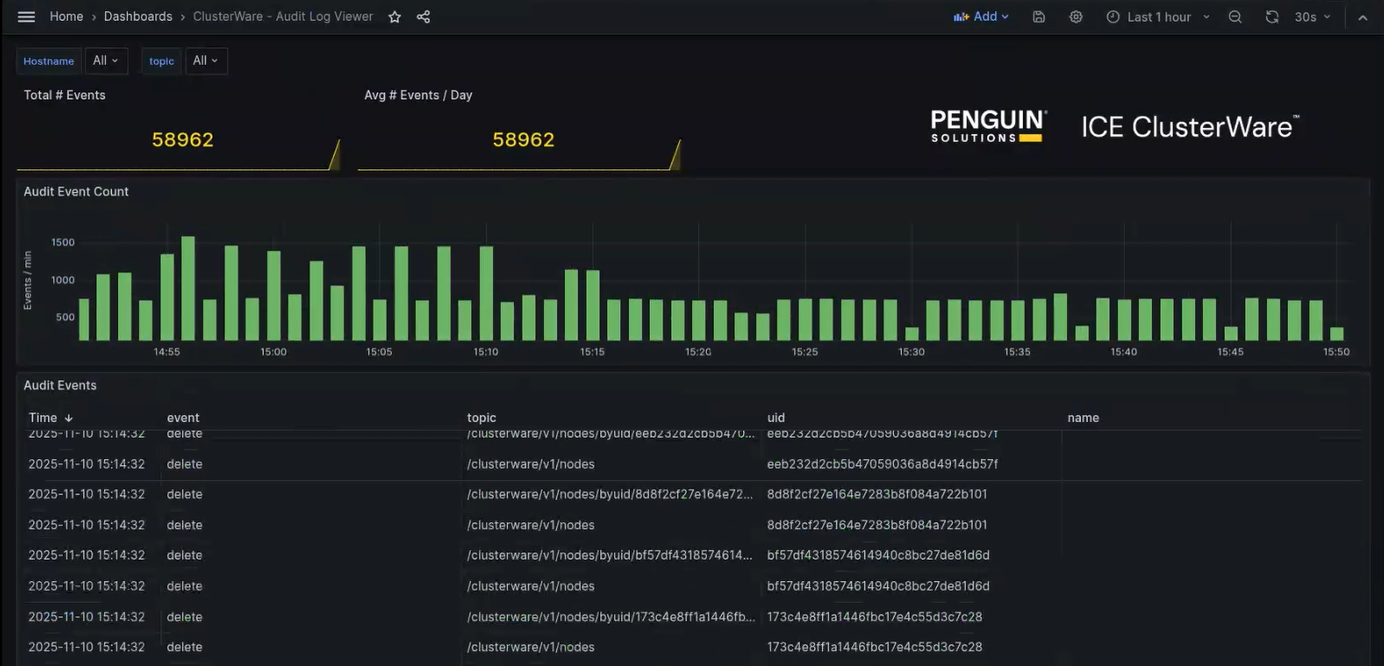
The ClusterWare - Audit Log Viewer dashboard displays messages shared by the ClusterWare software. For example, endpoint access messages or authentication actions are logged. Use the drop-down list at the top of the dashboard to filter and review log entries for a particular node. See Auditing to learn more about ClusterWare data collection.
Grafana Alerts#
You can define an Alerts dashboard with configurable panels and alert notifications.
Click the Alerting menu item (bell icon) in the left navigation panel.
On the Alert Rules tab, click New alert rule.
Define the conditions or events about which you want to receive alerts as well as how those alerts should be delivered to you.
An example Alerts dashboard is:
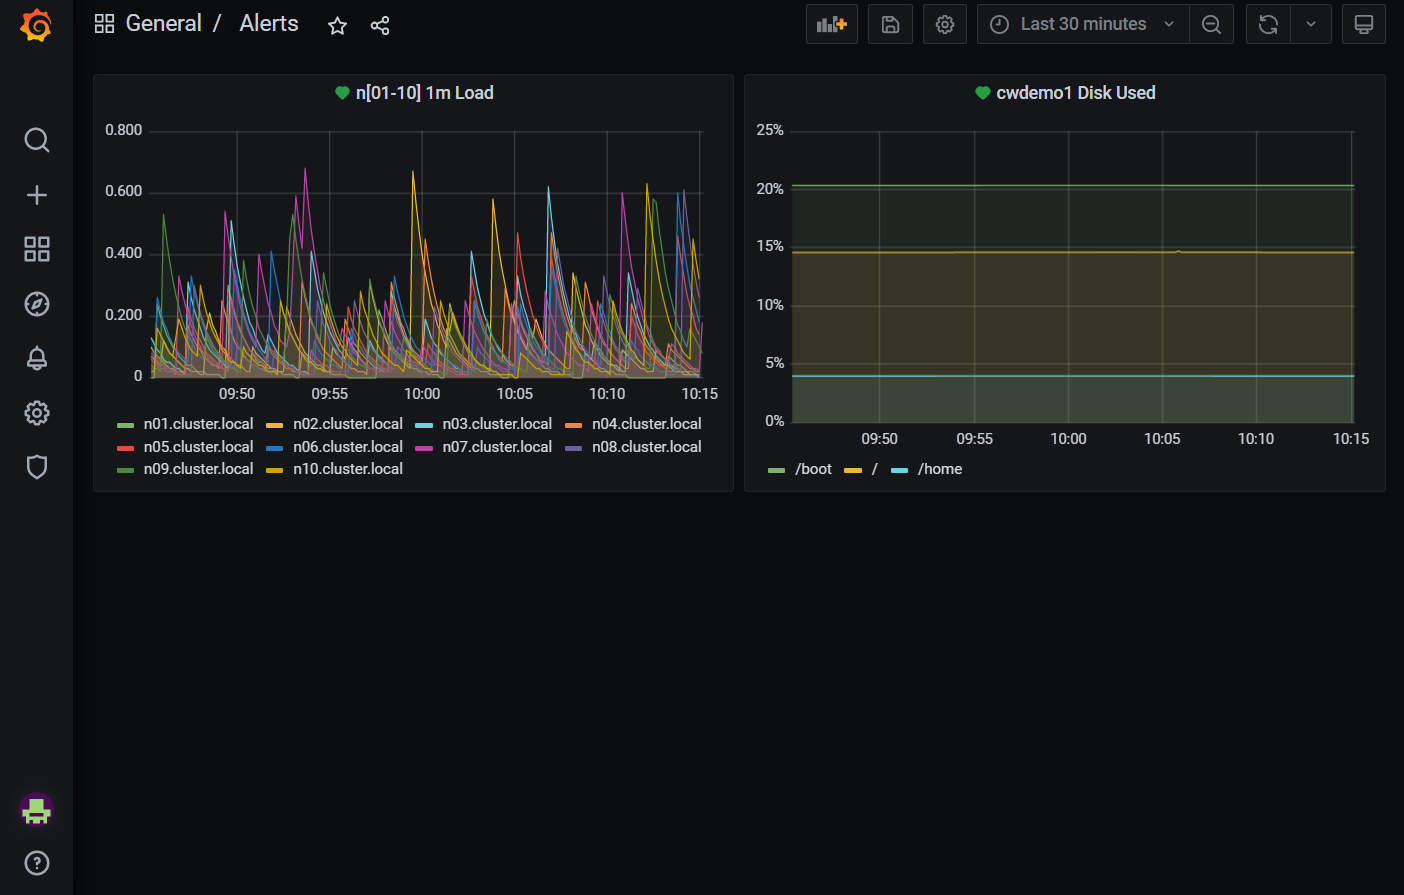
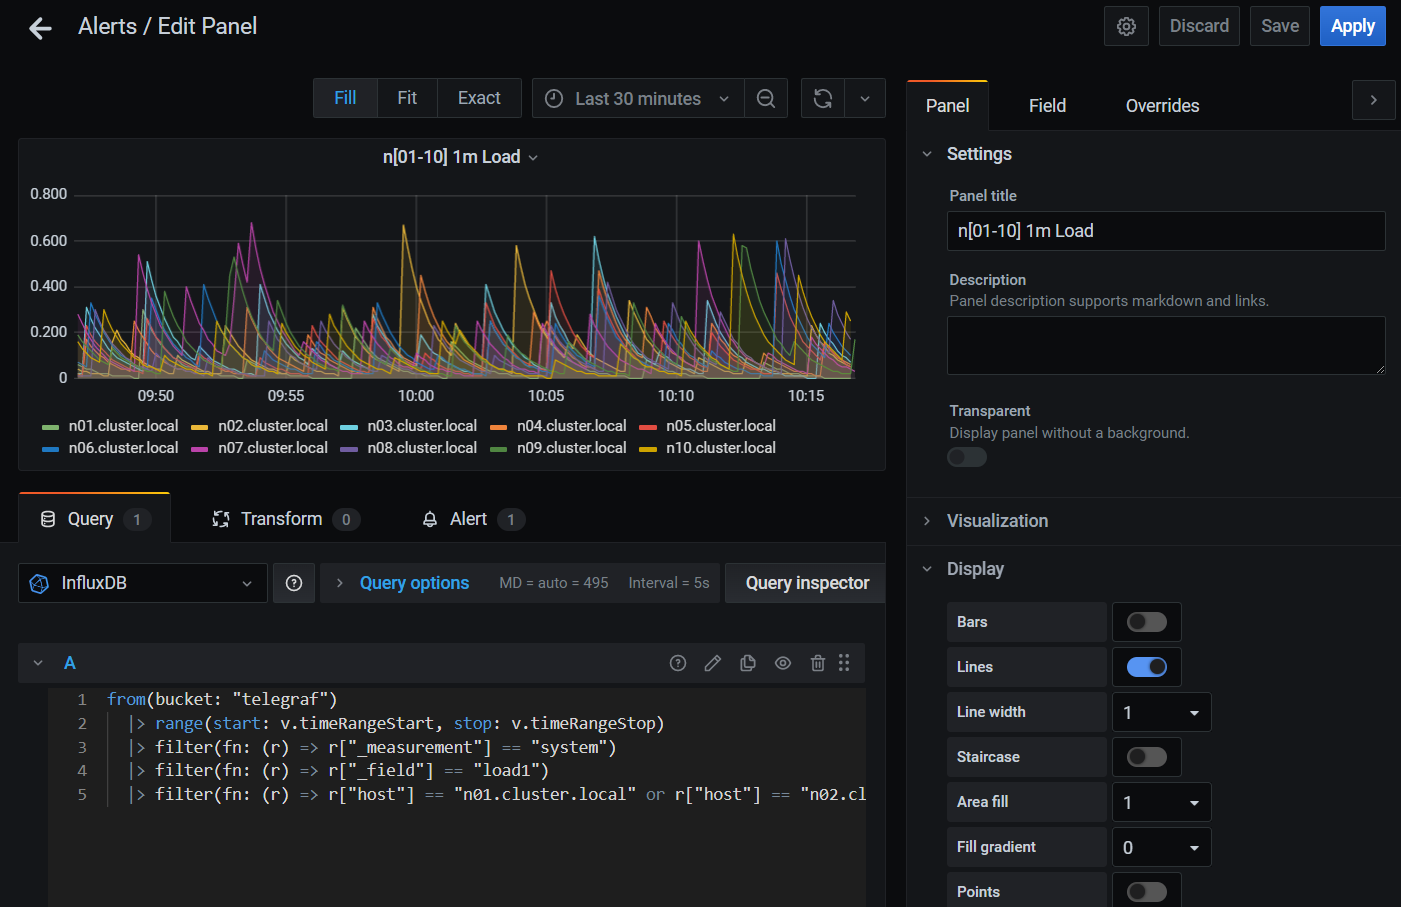
The first panel displays the CPU load levels for the first 10 compute nodes. The second panel displays the disk usage for one head node.
Alerts can be edited by clicking the title bar and selecting Edit from the drop-down menu. In the example below, the Query tab defines what gets shown in the panel. The Alert tab defines what values trigger an alert, what to send in an alert message, and where to send the message.
For details about setting up alerts, consult the Grafana Labs documentation: https://grafana.com/docs/grafana/latest/.